Targeted Buyer Outreach
Named calls into the Burbank owner pool, the 1031 exchange buyers trading in this size class, and the owner-user and private capital buyers who want a small Burbank building they can operate themselves.



Prepared Exclusively for Heberly Trust
September 2026
| Address | Units | Sale Price | $/Unit | Distance |
|---|---|---|---|---|
| 2907 W Riverside Drive | 4 | $1,590,000 | $397,500 | 1.86 mi |
| 143 N Maple St | 4 | $1,475,000 | $368,750 | 1.55 mi |
| 1213 North Screenland Drive | 6 | $1,800,000 | $300,000 | 0.09 mi |
| 157 W Ash Ave | 5 | $2,425,000 | $485,000 | 2.53 mi |
| 328 E Providencia Ave | 11 | $5,175,000 | $470,455 | 2.87 mi |
| 2501 North Glenoaks Boulevard | 6 | $1,530,000 | $255,000 | 2.31 mi |
| 422 South Lake Street | 14 | $7,250,000 | $517,857 | 2.34 mi |
| 336, & 342 E Providencia Ave | 24 | $7,050,000 | $293,750 | 2.98 mi |
| 703 East Providencia Avenue | 10 | $1,970,000 | $197,000 | 3.18 mi |
Published team performance, laaa.com/track-record, as of September 4, 2026.
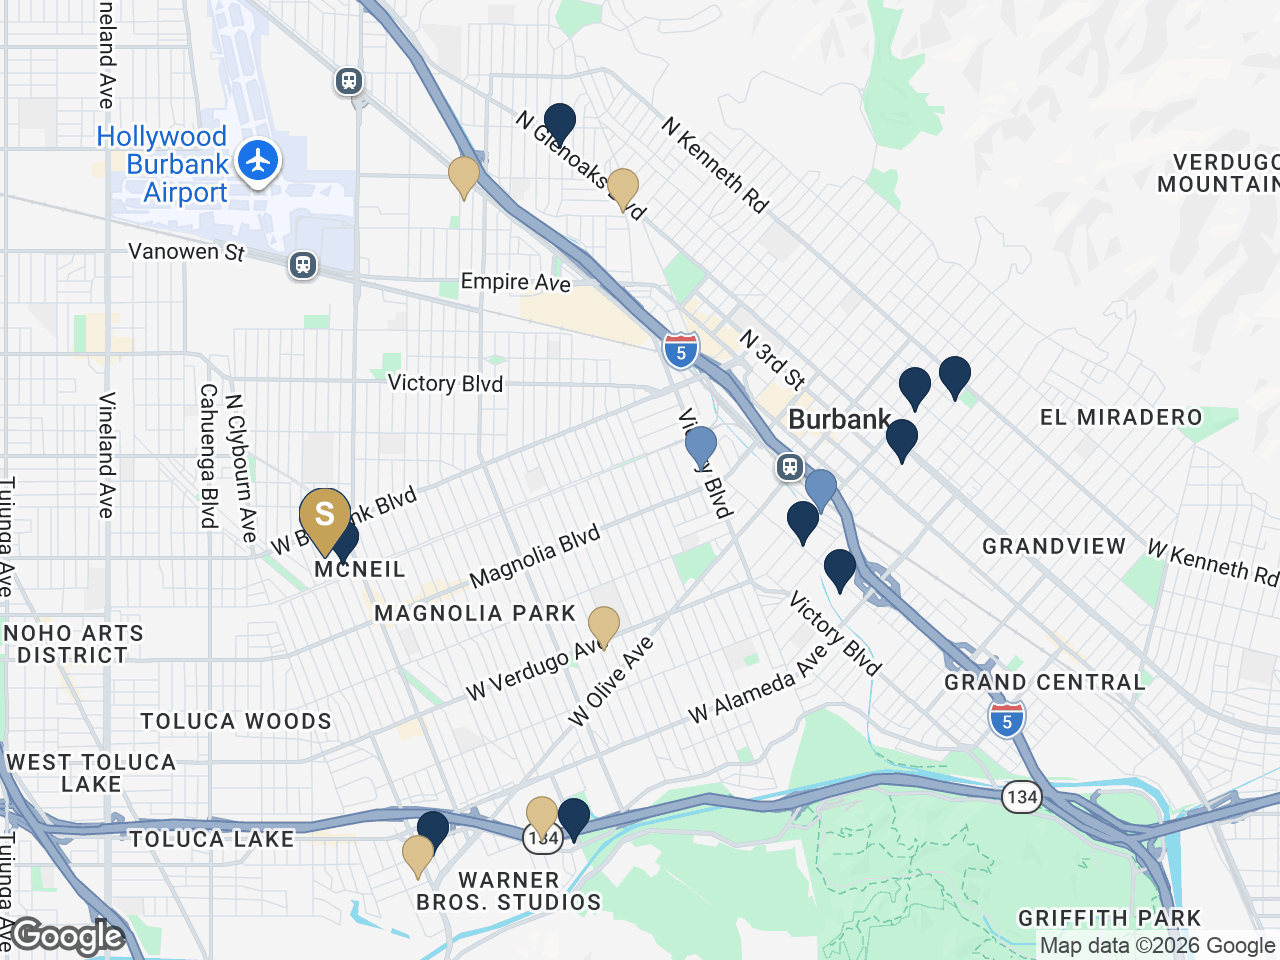
Kenwood St is the gold marker. Navy markers are the 10 apartment buildings the LAAA Team has closed in Burbank; lighter markers are 3 other LAAA closings in the same area. Repeat sales at one building share a marker. Source: laaa.com/track-record, as of September 3, 2026.
The LAAA Team has closed 494 transactions totaling $1.56B across 21 states and Washington, D.C., including 342 apartment sales covering 4,703 units.
Burbank is not a market we visit for one assignment. The closings listed below are ours, in this city, and one of them sits on Screenland Drive itself. The buyers who competed for them are the same buyers we will call about this portfolio.
• Chairman's Club - Marcus & Millichap's top-tier annual honor
• #1 in Multifamily Transactions, Los Angeles County - CoStar verified, trailing 3 years
• 10 Consecutive Sales Recognition Awards -
• 55 consecutive quarters with a closing - 96.7% apartment pricing accuracy
• 494 closed transactions - $1.56B in sales volume
Our public, continuously maintained reach combines active email subscribers, owner and investor contacts, a building-owner database, and targeted direct buyer calls for each listing.
Named calls into the Burbank owner pool, the 1031 exchange buyers trading in this size class, and the owner-user and private capital buyers who want a small Burbank building they can operate themselves.
Named calls into the Burbank small-building owner pool, the exchange buyers who have closed on product this size in the last twenty four months, and the local private capital already holding buildings within a mile.
Marcus & Millichap is CoStar verified as #1 in multifamily transactions in Los Angeles County over the trailing three years, on both listing agent and buyer agent rankings. What that buys this listing is reach: national distribution, the firm's investor database, and coordination with Marcus & Millichap Capital Corporation so a buyer arrives pre-qualified rather than exploring.
A property-specific offering site, targeted email to 36,000+ owner and investor contacts, and syndication to CoStar, LoopNet, Crexi, MLS and the Marcus & Millichap platform.
Most brokers are reactive. They post the listing, run an email blast, and wait for the phone to ring. We do all of that, and we do it well. Then we do the part almost nobody does. We pick up the phone.
Before the buildings go to market, our system builds a probable buyer list for them specifically. It pulls the county assessment record for every property in the surrounding area: who owns it, where their mail goes, what they paid, when they bought, who financed it, and how many other buildings they hold. Out of that come the three groups most likely to buy a small Burbank building: owners of comparable product nearby, buyers who have closed on buildings this size recently, and exchange buyers with money that has to be placed on a deadline.
That list runs well over 100 names, and we call every one of them.
Eleven verified Burbank triplex sales set the frame, every one confirmed on its county record as a three-unit property. Across the full set price per unit runs $353,333 to $666,833. Dropping the size outlier and a six-week resale leaves nine sales with a $408,333 median price per unit and a $582.73 median price per square foot. The subject is larger than the trimmed median comp, which is why price per unit reads lower here than price per square foot does. Every one of the four sales carrying MLS history closed at or above ask, two by double digits, on 32 to 55 days.
The realistic buyer is an owner-user or a low-leverage private investor rather than a levered yield buyer. At current rates debt service on a conventionally financed purchase runs close to net operating income, which is normal for Burbank product this size and is why the pool skews toward buyers who are not solving for leveraged return.
A buyer who occupies one unit and rents the other two. In-unit laundry in all three units and a residential block matter more to this buyer than a yield calculation, and they are the buyer most likely to pay for condition.
An exchange buyer with a deadline who wants a clean, fully occupied, self-managed asset in a city with no local rent stabilization ordinance. Three units on one parcel is a manageable close inside a 45 day identification window.
Both buildings are fully occupied with rents sitting at market, and the capital items a buyer normally holds money back for have already been addressed. The campaign leads with what a buyer gets on day one rather than with a repositioning story.
1243 N Kenwood St is a three unit apartment building in Burbank, built in 1948 and held by the Heberly Trust. The building runs 2,578 gross SF on a 6,245 SF lot under assessor parcel 2476-004-001, configured as one 1 Bed and two 2 Bed units, every one of them a single-bathroom plan with its own washer and dryer.
This prices as a stabilized asset rather than a repositioning. All three units are occupied, the rents in place sit at or above the asking rents in the surrounding two-mile set, and there is no lease-up story to underwrite. A buyer is paying for current cash flow, a large building on a small-building street, and a maintenance history that has been attended to rather than deferred.
The realistic buyer is an owner-user or a low-leverage private investor rather than a levered yield buyer. At current rates debt service on a conventionally financed purchase runs close to net operating income, which is normal for Burbank product this size and is why the pool skews toward buyers who are not solving for leveraged return.
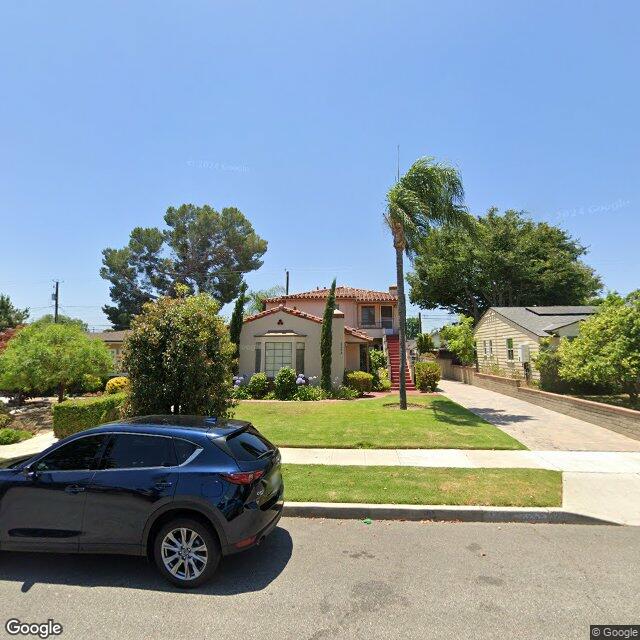
The property sits on N Kenwood St in Burbank 91505, on a residential block rather than an arterial. Two of the eleven triplex sales framing this valuation closed within a mile and a half, and the nearest, 1301 N Cordova St, is a fifth of a mile away and shares the same 1948 vintage.
Burbank calls itself the Media Capital of the World and carries more than a thousand media and entertainment companies inside the city limits. Its largest employers are The Walt Disney Company, Netflix, Tesla, Nickelodeon and Warner Bros. Disney runs its world corporate headquarters here, Warner Bros. holds its historic lot and headquarters, and Nickelodeon Animation Studio, Cartoon Network Studios and Netflix Animation all sit within the same few square miles. Tesla on that list matters: the largest employer roster is no longer only studios.
The numbers a landlord should care about are the daytime ones. Burbank houses roughly 104,000 residents and carries a daytime population of 250,000, so it imports its workforce rather than exporting it. The city puts average annual household income at $151,000. Downtown Los Angeles is 12 miles away.
The studios are still building. Warner Bros. completed its Second Century project, an 800,000 SF Frank Gehry-designed headquarters in two buildings of roughly 355,000 and 445,000 SF, and took the whole complex as sole long-term tenant. It then redeveloped its 30-acre Ranch campus into roughly 926,000 SF carrying 16 new soundstages and opened it in 2026, with every stage certified by the California Film Commission so a production filming there qualifies for the state subsidy. Digital creators and influencers have begun taking Burbank stage space of their own.
The open question in this market is ownership rather than occupancy. Warner Bros. Discovery shareholders approved a Paramount Skydance acquisition in April 2026 at $31 a share, roughly $111B including debt, and the Department of Justice cleared it the following month. Twelve state attorneys general sued to block it in July 2026 and a federal judge issued a temporary restraining order. The transaction is expected to close between September and December 2026 and had not closed when this opinion was written.
The largest piece of public investment in the city finishes next month. Hollywood Burbank Airport replaces the terminal it has used since 1930 with a $1.3B, 355,000 SF, 14-gate building under the Elevate BUR program. The ribbon cutting is 5 October 2026 and the terminal opens to passengers on 13 October 2026.
Downtown has filled in around it and now records 4.9 million visitors a year. The corridor added 28 restaurants over four years with at least seven more due in 2026, drawing Van Leeuwen Ice Cream, Color Me Mine, Flow Wine and Coffee, Miniso, The Melt and Sky Zone, plus an immersive science fiction cantina taking space at Burbank Entertainment Village beside the AMC Burbank 30, which is the highest-grossing AMC theater in the United States. The city also holds the largest Ikea store in the country. Four hotels are in the pipeline, and an adopted Civic Center plan carrying a new library, a plaza and event space is projected to start construction in summer 2027.
On the residential side, roughly 800 housing units were recently added downtown as part of about 1,000 approved, under construction or newly opened. The largest projects are 862 units at 2311 N Hollywood Way beside the Metrolink station and the airport, and 573 rental units at 777 Front Street whose housing is complete with its commercial component due in 2028. First Street Village has delivered its first phase. The Downtown Transit Oriented Development Specific Plan studies capacity for as many as 9,944 additional units over its full horizon.
Two counterweights belong in the same picture. Burbank office vacancy has climbed above 21% after entertainment companies shed space following the writers' and actors' strikes, and soundstage occupancy across Los Angeles remains well below boom-year levels. Leasing has continued through it: a buyer tied to the streamer Dropout bought a Burbank studio property to consolidate production, and Concorde Career Colleges signed a 48,000 SF downtown lease.
The residential pipeline deserves a straight answer rather than a selective one. It is concentrated in the downtown core and in large institutional product, which competes for a different renter than a three unit building on a residential street, and none of it is a direct substitute for this asset. It is still new supply in the same city and it is the thing to watch on rent growth over a hold. The office vacancy is a studio-office problem rather than a housing one, and the daytime population is what actually fills apartments here. Burbank is a job center first, which is why its small buildings trade on thin inventory and why all four of the triplex sales in this analysis that carried MLS history closed at or above their ask.
| Property & Location Details | |
|---|---|
| Address | 1243 N Kenwood St, Burbank, CA 91505 |
| City | Burbank, CA 91505 |
| APN | 2476-004-001 |
| Year Built | 1948 |
| Building SF | 2,578 |
| Lot Size | 6,245 SF (0.1434 ac) |
| Units | 3 |
| Parking | On-site parking count is pending confirmation with ownership |

| Property Overview | |
|---|---|
| Units | 3 |
| Year Built | 1948 |
| Building SF | 2,578 |
| Lot SF | 6,245 |
| APN | 2476-004-001 |
| Unit Mix | |
|---|---|
| 1x 1 Bed / 1 Bath | 700 (est.) SF |
| 2x 2 Bed / 1 Bath | 850 (est.) SF |
One parcel, three units, 2,578 gross SF on a 6,245 SF lot. The mix is one 1 Bed and two 2 Bed units, all single bathroom, averaging 859 SF per unit against a trimmed comparable median near 2,263 SF across three units. Per-unit square footage is allocated as an estimate and is not a measured figure. There is no common-area electrical meter and no common laundry room.
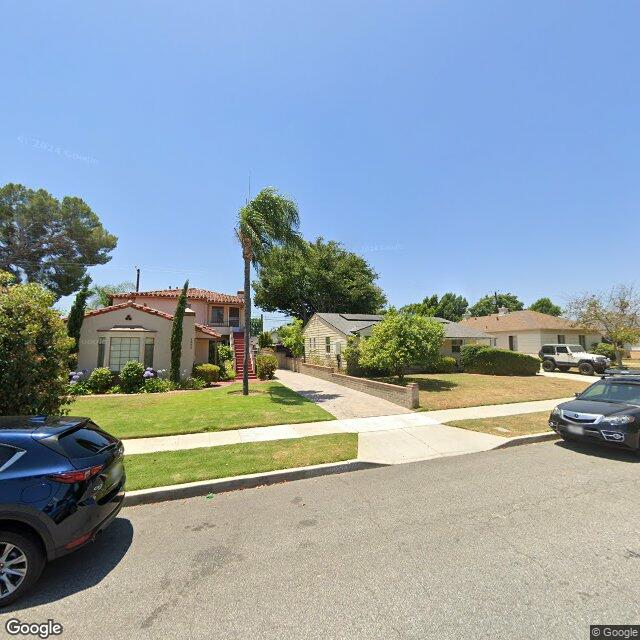
Click any image to enlarge. Images depict the property and representative interiors. Source: listing media and site photography.

| Address | Unit Type | SF | Asking Rent | Distance |
|---|---|---|---|---|
| 11501 N Hollywood Way, Apt B, Burbank, CA 91505 | 1 Bed / 1 Bath | 700 (est.) | $1,850 | 0.32 mi |
| 25245 Riverton Ave, Apt 102, North Hollywood, CA 91601 | 1 Bed / 1 Bath | 750 (est.) | $2,195 | 0.91 mi |
| 3140 S Buena Vista St, Apt O, Burbank, CA 91505 | 1 Bed / 1 Bath | 725 (est.) | $1,900 | 1.55 mi |
| 42253 N Niagara St, Apt B, Burbank, CA 91504 | 1 Bed / 1 Bath | 700 (est.) | $1,995 | 1.58 mi |
| 5426 N Lomita St, Apt C, Burbank, CA 91506 | 1 Bed / 1 Bath | 600 (est.) | $2,195 | 1.81 mi |
| Average (5 comps) | 695 (incl. est.) | $2,027 | 1.23 mi | |
| Address | Unit Type | SF | Asking Rent | Distance |
|---|---|---|---|---|
| 6600 N Whitnall Hwy, Apt 203, Burbank, CA 91505 | 2 Bed / 2 Bath | 1,100 (est.) | $2,995 | 0.90 mi |
| 7528 N Fairview St, Burbank, CA 91505 | 2 Bed / 2 Bath | 800 (est.) | $3,600 | 0.98 mi |
| 811100 Camarillo St, Apt 4, North Hollywood, CA 91602 | 2 Bed / 2 Bath | 800 (est.) | $2,395 | 1.57 mi |
| 94418 Ensign Ave, Apt 1, North Hollywood, CA 91602 | 2 Bed / 1 Bath | 900 (est.) | $2,295 | 1.84 mi |
| 106212 Beck Ave, Apt 1, North Hollywood, CA 91606 | 2 Bed / 1 Bath | 750 (est.) | $2,495 | 1.97 mi |
| Average (5 comps) | 870 (incl. est.) | $2,756 | 1.45 mi | |
Ten active asking rents within two miles frame the market. One bedrooms ask $1,850 to $2,195 and two bedrooms ask $2,295 to $3,600. The subject's 1 Bed is in place at $2,200, above every one bedroom in the set, and the two 2 Bed units are in place at $2,700 and $2,800, inside the two bedroom range. The two exact 2 Bed, 1 Bath configuration matches ask $2,295 and $2,495, both below the subject, and neither has in-unit laundry. These are asking rents from listing sources, not signed leases, and they are not represented as achieved subject rents.

| Address | Yr | Units | Bldg SF | Land SF | Sale Price | $/Unit | $/SF | $/Land SF | Date |
|---|---|---|---|---|---|---|---|---|---|
| 11301 N Cordova St, Burbank, CA 91505 | 1948 | 3 | 1,925 | 5,768 | $1,175,000 | $391,667 | $610 | $203.71 | 2026-08-05 |
| 2619 N Hollywood Way, Burbank, CA 91505 | 1939 | 3 | 2,070 | 5,151 | $1,499,000 | $499,667 | $724 | $291.01 | 2026-07-27 |
| 3716 E San Jose Ave, Burbank, CA 91501 | 1922 | 3 | 3,182 | 7,452 | $1,650,000 | $550,000 | $519 | $221.42 | 2026-05-05 |
| 4242 N Cordova St, Burbank, CA 91505 | 1949 | 3 | 2,320 | 6,623 | $1,150,000 | $383,333 | $496 | $173.64 | 2026-04-24 |
| 51212 W Victory Blvd, Burbank, CA 91506 | 1942 | 3 | 1,912 | 5,434 | $1,225,000 | $408,333 | $641 | $225.43 | 2026-04-15 |
| 6419 W Riverside Dr, Burbank, CA 91506 | 1947 | 3 | 2,222 | 5,808 | $1,700,000 | $566,667 | $765 | $292.70 | 2026-04-07 |
| 71923 Grismer Ave, Burbank, CA 91504 | 1923 | 3 | 2,504 | 6,400 | $1,060,000 | $353,333 | $423 | $165.62 | 2025-10-29 |
| 81025 W Clark Ave, Burbank, CA 91506 | 1952 | 3 | 2,304 | 8,324 | $1,485,000 | $495,000 | $645 | $178.40 | 2025-09-18 |
| 91980 N Ontario St, Burbank, CA 91505 | 1951 | 3 | 2,325 | 6,098 | $1,290,000 | $430,000 | $555 | $211.54 | 2025-09-16 |
| 101205 W Alameda Ave, Burbank, CA 91506 | 1951 | 3 | 2,085 | 7,078 | $1,215,000 | $405,000 | $583 | $171.66 | 2025-09-05 |
| 11303 S Kenneth Rd, Burbank, CA 91501 | 1976 | 3 | 4,500 | 7,496 | $2,000,500 | $666,833 | $445 | $266.88 | 2025-08-21 |
| Median (11 comps) | 1948 | 3 | 2,304 | 6,400 | $1,290,000 | $430,000 | $583 | $211.54 | - |
Eleven verified Burbank triplex sales set the frame, every one confirmed on its county record as a three-unit property. Across the full set price per unit runs $353,333 to $666,833. Dropping the size outlier and a six-week resale leaves nine sales with a $408,333 median price per unit and a $582.73 median price per square foot. The subject is larger than the trimmed median comp, which is why price per unit reads lower here than price per square foot does. Every one of the four sales carrying MLS history closed at or above ask, two by double digits, on 32 to 55 days.
1. 1301 N Cordova St, Burbank, CA 91505 - Closest triplex sale to the subject at under a quarter mile, identical 1948 vintage, and the smallest building in the set. Closest triplex sale to the subject at under a quarter mile, identical 1948 vintage, and the smallest building in the set. Closed 12.0% above a $1,049,000 ask in 50 days.
2. 619 N Hollywood Way, Burbank, CA 91505 - Three separate buildings on a 5,151 SF lot, an unusual configuration, and fronting Hollywood Way rather than a residential street. Three separate buildings on a 5,151 SF lot, an unusual configuration, and fronting Hollywood Way rather than a residential street. Closed at full ask in 55 days.
3. 716 E San Jose Ave, Burbank, CA 91501 - Substantially larger building at 3,182 SF and the oldest vintage in the set at 1922, nearly three miles east of the subject. Substantially larger building at 3,182 SF and the oldest vintage in the set at 1922, nearly three miles east of the subject. Closed 6.5% above a $1,550,000 ask in 40 days.
4. 242 N Cordova St, Burbank, CA 91505 - Nearest match in the set on vintage and building size: 1949 against 1948, and 2,320 SF against the subject's 2,578 SF. Nearest match in the set on vintage and building size: 1949 against 1948, and 2,320 SF against the subject's 2,578 SF. Closed 15.6% above a $995,000 ask in 32 days, the largest premium to list in the set.
5. 1212 W Victory Blvd, Burbank, CA 91506 - Smallest building in the set at 1,912 SF and fronting Victory Blvd, an arterial, rather than a residential street. Smallest building in the set at 1,912 SF and fronting Victory Blvd, an arterial, rather than a residential street. Off-market sale with no MLS listing history.
6. 419 W Riverside Dr, Burbank, CA 91506 - Comparable 1947 vintage and 2,222 SF building, but the highest price per square foot in the set at $765. Comparable 1947 vintage and 2,222 SF building, but the highest price per square foot in the set at $765. A six-week resale that reads as a completed renovation, so its pricing reflects a finished product rather than original condition.
7. 1923 Grismer Ave, Burbank, CA 91504 - Similar 2,504 SF building size with six bedrooms, but 1923 vintage, the second oldest in the set. Similar 2,504 SF building size with six bedrooms, but 1923 vintage, the second oldest in the set. Off-market sale and the lowest price per unit in the set at $353,333.
8. 1025 W Clark Ave, Burbank, CA 91506 - Close match on building size at 2,304 SF and vintage at 1952, on the largest lot in the set at 8,324 SF. Close match on building size at 2,304 SF and vintage at 1952, on the largest lot in the set at 8,324 SF. Off-market sale.
9. 1980 N Ontario St, Burbank, CA 91505 - Close match on building size at 2,325 SF, vintage at 1951, and lot size at 6,098 SF, with six bedrooms against the subject's five. Close match on building size at 2,325 SF, vintage at 1951, and lot size at 6,098 SF, with six bedrooms against the subject's five. Off-market sale.
10. 1205 W Alameda Ave, Burbank, CA 91506 - Smaller building at 2,085 SF on a larger 7,078 SF lot, 1951 vintage. Smaller building at 2,085 SF on a larger 7,078 SF lot, 1951 vintage. Off-market sale.
11. 303 S Kenneth Rd, Burbank, CA 91501 - Roughly double the median building size in the set at 4,500 SF, with seven bedrooms and six bathrooms, and 1976 vintage against the subject's 1948. Roughly double the median building size in the set at 4,500 SF, with seven bedrooms and six bathrooms, and 1976 vintage against the subject's 1948. Off-market sale and the highest price per unit in the set at $666,833.
| Basis | Price | $/Unit | $/SF | GRM Current | GRM Pro Forma | Cap Current | Cap Pro Forma |
|---|---|---|---|---|---|---|---|
| Suggested list price | $1,145,000 | $381,667 | $444.14 | 12.39 | 11.66 | 5.54% | 6.04% |
| Midpoint | $1,102,500 | $367,500 | $427.66 | 11.93 | 11.22 | 5.80% | 6.31% |
| Range bottom | $1,060,000 | $353,333 | $411.17 | 11.47 | 10.79 | 6.08% | 6.62% |
Property taxes reassess at the sale price, so the net operating income and therefore the capitalization rate are recalculated at every rung above.
| Units | Type | Approx SF | Current Rent | Current Monthly | Market Rent | Market Monthly |
|---|---|---|---|---|---|---|
| 1 | 1 Bed / 1 Bath | 700 (est.) | $2,200 | $2,200 | $2,395 | $2,395 |
| 2 | 2 Bed / 1 Bath | 850 (est.) | $2,750 | $5,500 | $2,895 | $5,790 |
| Total Scheduled Rent | $2,567 | $7,700 | $2,728 | $8,185 | ||
| Additional Income[1] | - | $0 | - | $0 | ||
| Monthly Scheduled Gross Income | - | $7,700 | - | $8,185 | ||
| Current | Market | |
|---|---|---|
| Scheduled Gross Income[2] | $92,400 | $98,220 |
| Vacancy Reserve at 3.0%[3] | ($2,772) | ($2,947) |
| Gross Operating Income | $89,628 | $95,273 |
| Operating Expenses | ($26,172) | ($26,172) |
| Net Operating Income | $63,456 | $69,101 |
| Loan Payments (Illustrative) | ($49,427) | ($49,427) |
| Pre-Tax Cash Flow (Illustrative) | $14,029 | $19,674 |
| Principal Reduction (Illustrative) | $4,155 | $8,693 |
| Total Return Before Taxes | $18,184 | $28,367 |
| Current | Pro Forma | |
|---|---|---|
| Insurance[4] | $3,222 | $3,222 |
| Other Expense[5] | $1,800 | $1,800 |
| Repairs Maintenance[6] | $2,250 | $2,250 |
| Reserves[7] | $600 | $600 |
| Taxes[8] | $13,740 | $13,740 |
| Utilities[9] | $4,560 | $4,560 |
| Total Operating Expenses | $26,172 | $26,172 |
| Expense Ratio | 29.2% | 27.5% |
| Per Unit | $8,724 | $8,724 |
| Per Square Foot | $10.15 | $10.15 |
[1] Additional Income: No other income. Every unit has an in-unit washer and dryer, so there is no common laundry room and no laundry income.
[2] Scheduled Gross Income: Rents in place across all three units as carried in the M&M model rent roll.
[3] Vacancy Reserve: A 3.0% vacancy and collection allowance a buyer will underwrite regardless of current full occupancy.
[4] Real Estate Taxes: Reassessed at the recommended value under Proposition 13 using the tax rate area 2530 rate. A buyer's bill will differ from ownership's current bill.
[5] General & Administrative: Underwritten allowance. The property is self-managed today and carries no third-party management fee.
[6] Repairs Maintenance: Underwritten annual estimate, not a seller T12 actual.
[7] Reserves: Underwritten annual estimate, not a seller T12 actual.
[8] Taxes: Property taxes reassessed to the recommended value, which is the figure a buyer will carry.
[9] Utilities: Underwritten annual estimate, not a seller T12 actual.
Owner-reported figures are unaudited. A buyer should verify all income and expenses in due diligence.
| Operating Data | |
|---|---|
| Price | $1,145,000 |
| Number of Units | 3 |
| Price per Unit | $381,667 |
| Price per SF | $444.14 |
| Current GRM | 12.39 |
| Market GRM | 11.66 |
| Current Cap Rate (LAAA calculation: current NOI / recommended value) | 5.54% |
| Market Cap Rate (LAAA calculation: market NOI / recommended value) | 6.04% |
| Proposed Financing (Illustrative) | |
|---|---|
| Loan Amount | $687,000 |
| Down Payment | $458,000 |
| Interest Rate | 6.00% |
| Amortization | 30 years |
| DCR | 1.28 |
Illustrative financing assumption. Not a quoted or committed loan. A buyer should obtain its own terms.
$1,145,000, or $381,667 per unit and $444.14 per SF. That is a 5.54% cap on current net operating income of $63,456 and a 12.39 gross rent multiplier on scheduled rent of $92,400. Operating expenses run 29.20% of effective gross income. The opinion runs from $1,060,000 up to the $1,145,000 ask, which sits at the top of the range. The floor is the lowest price per unit in the trimmed nine-sale set.
Supported value range: $1,060,000 to $1,145,000
Every rent, expense and price figure in this analysis comes from the Marcus & Millichap Multifamily Model recalculated and saved on 3 September 2026. Property taxes are reassessed to the recommended value under Proposition 13, so a buyer's bill will differ from the current bill. Refuse is carried at $1,440 per year pending confirmation of who pays it at this parcel.
Unit count, year built, building area and lot area are as recorded by the Los Angeles County Assessor under AIN 2476-004-001. Per-unit square footage is an allocated estimate, not a measured figure, and rent per square foot derived from it carries that limitation.
No comparable rent rolls were available for the triplex sale set, so no transaction cap rate or gross rent multiplier is computed for any comparable. Every comparable metric shown is a physical metric. Leased-status rent comparables would tighten the market rent conclusion and have not been obtained at proposal stage.